A single poor quality deliverable can create a cycle of low performance, creating an environment where quality is not valued and people do not put in the extra effort to deliver high quality products.
Likewise, controlling the quality of a project’s deliverables can be the silver bullet that makes everything else feel easy. Fortunately, the Project Management Body of Knowledge (PMBOK) gives the project manager the guidance you need to make sure the products being produced are of the required quality.
The process is called Quality Control, and it falls under the Project Quality knowledge area in the Monitoring & Controlling process group.
PMBOK, 5th Edition, Section 8.3, “Control Quality”
Control Quality is the process of monitoring and recording results of executing the quality activities to assess performance and recommend necessary changes. The key benefits of this process include: (1) identifying the causes of poor process or product quality and recommending and/or taking action to eliminate them; and (2) validating that project deliverables and work meet the requirements specified by key stakeholders necessary for final acceptance.
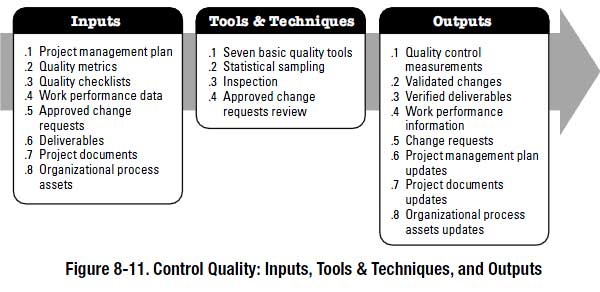
The Inputs, Tools & Techniques, and Outputs look like this:
Quality Control vs. Quality Assurance
This distinction is commonly misunderstood. Quality Control (QC) is the measurement of outputs to determine whether they meet the accepted criteria. Quality Assurance (QA), on the other hand, analyzes the processes and systems that are producing the outputs. If you’re measuring the systems, it’s QA. If you’re measuring the outputs, it’s QC.
Measuring Outputs
When project deliverables are produced, they are subjected to quality control before they are delivered to their end user. That means they need to be measured and compared against the standard that’s been identified in the project management plan. The quality of the outputs is then used to make decisions on project changes.
Quality criteria should have been identified during the planning phase (PMBOK: Plan Quality Management) for each project deliverable.
Sometimes outputs are singular in nature, like a project report, which doesn’t lend itself well to quantitative measurement against a standard. But there are always quality standards that apply, for example when the reader of the report notices technical errors or excessive spelling mistakes it is clear that they are applying a quality standard to the work. Therefore, what is required to meet that standard? The project management plan could identify things like expert technical review, grammatical review, management review, and the like. When the review is done, quality control has been completed.
Examples of quality control include:
- Inspection of products leaving the production line.
- Trial runs prior to plant commissioning.
- Expert technical review of reports.
QC Forms
During the planning phase the project manager should develop appropriate forms for measuring the quality of the deliverables. This ensures that consideration has been given at the outset to measuring the right things and how they will be reported. When the inevitable issues arise and questions are asked, it is often invaluable to be able to produce a document that confirms the quality of the deliverables.
It is also essential to confirm that the deliverables have met the needs of the customer.
Quality Metrics
The project management plan will identify what will be measured and the pass/fail criteria. In the case of a manufacturing facility for a new line of pens, you might measure whether they draw a straight line without problems, if they come apart after using them for 10 minutes, or if the ink dries up after leaving them open for 4 hours. You would choose to take a predefined number of pens off the assembly line for testing. The results would be graphed, analyzed or presented to the project management team.
Some basic knowledge of statistics is helpful. Determining the standard deviation, mean, median, or mode of a data set helps to visualize the impact and severity of the results. Many statistical tools are available, and in fact the term quality control sometimes includes extensive statistical presentation of the results. Although the analysis of the results officially falls under quality assurance instead of quality control, there is a large overlap when alot of statistical analysis is done (Are you presenting the data or analyzing it?).
Here is a list of possible quality metrics:
- Failure rate
- Defect frequency
- on-time performance
- on-budget performance
- Reliability
- Mean Time Between Failure (MTBF)
- Mean Time to Repair (MTTR)
Prevention vs. Inspection
It is important to note the distinction between prevention, which keeps errors from happening, and inspection, which keeps errors out of the hands of the customer. Inspection is generally the domain of Quality Control, while prevention is concerned with improving the processes so that problems do not occur, thus it is Quality Assurance. But there is an overlap, particularly when Quality Control identifies issues with the end product and the systems and processes need to be updated.
Tolerance vs. Control Limits
A few definitions which should guide your quality perspective:
- Tolerance is the range of acceptable results. If a result is out of tolerance, it must be rejected.
- Control limits are boundaries which represent acceptable variation for the purpose of controlling and manipulating the process. A result can be within acceptable tolerances, but signify a process which exhibits certain unacceptable behaviors and/or requires additional development.
Attributes vs. Variables Sampling
When taking quality control measurements, the data can be collected based on the following two methods:
- Attributes sampling contains a single pass/fail criteria. The product either passes or fails.
- Variables sampling contains a sliding scale criteria. The product is rated on a scale of 1-10, class A-E, or similar.
Planned vs. Actual Data
For some projects, the planned results should be identified and then actual results tracked side by side to ensure the conformance of the deliverables. This type of comparison helps tremendously in the identification of schedule and cost related to quality improvement.
Project Changes
The PMBOK dictates that quality control activities result in project changes (see above Outputs: Change Requests).
If the quality control measurements reveal quality levels below the standards specified within the Quality Management Plan (a component of the overall Project Management Plan) a change to the project must be initiated through the change procedures within the project management plan. The Quality Management Plan is updated accordingly, and it then requires approval by the project sponsor to make it official. The project changes are also entered into the Change Log.


